HafniumPlotter 1.71


Funding for development of HafniumPlotter was provided by the Arizona LaserChron Center (laserchron.org). HafniumPlotter is currently supported at Idaho State University.
Example Figures
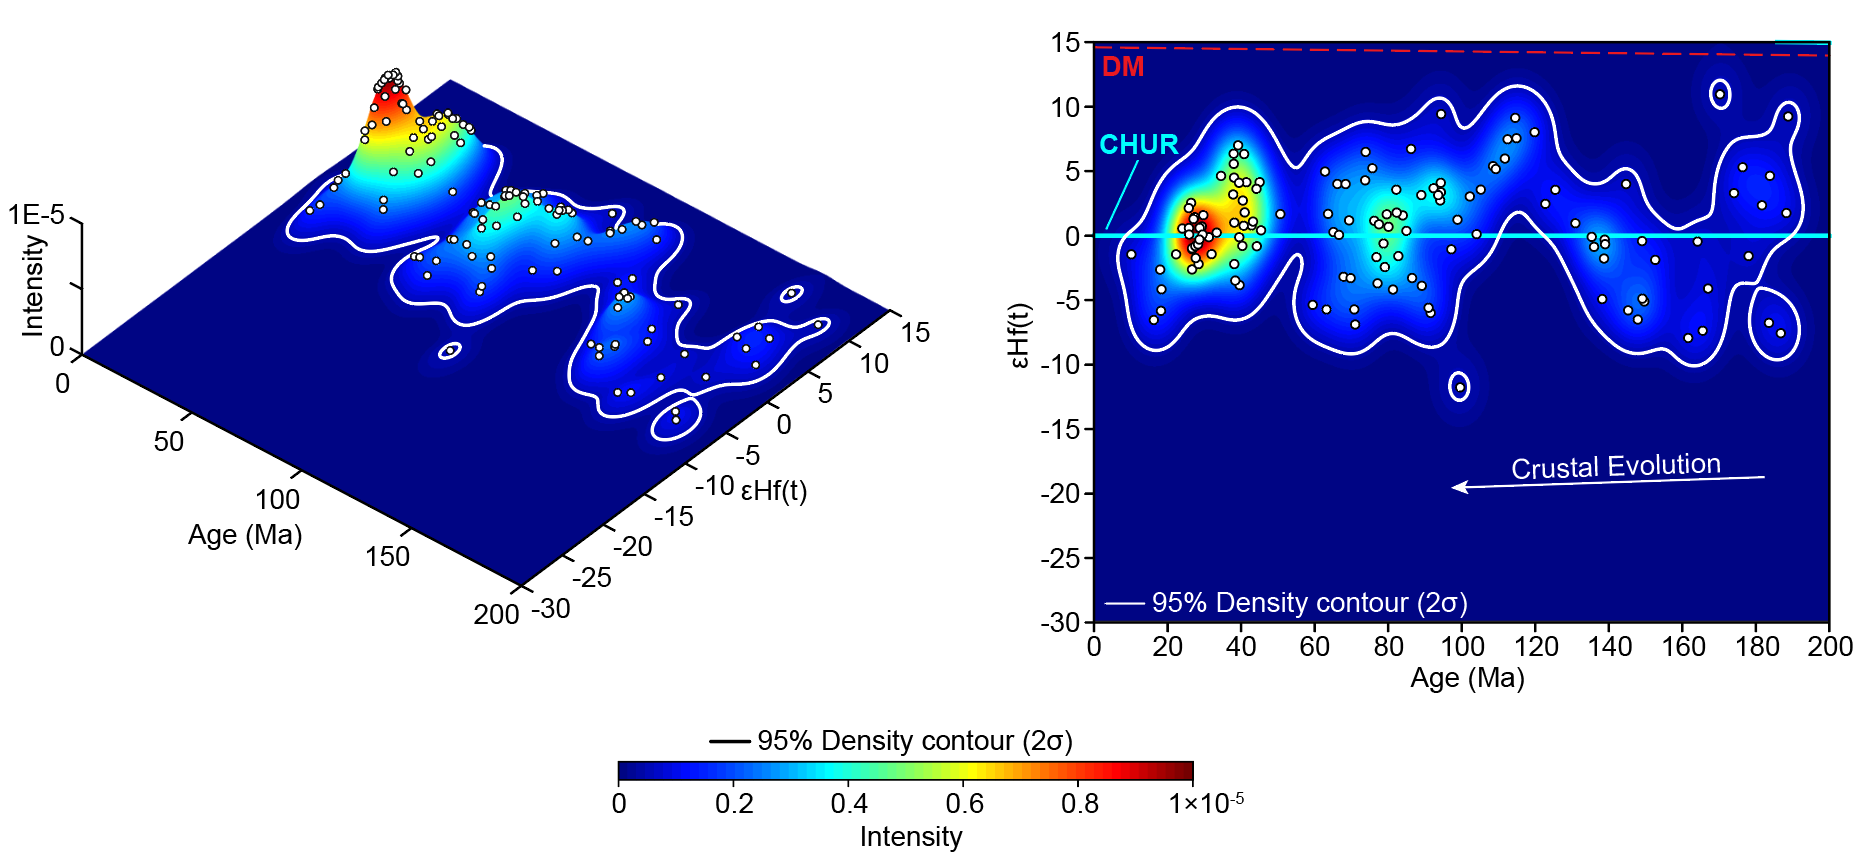
Figure from Sundell et al. (2019), Andean Tectonics: “Sediment provenance and recycling of detrital zircons from Cenozoic Altiplano strata in southern Peru and implications for the crustal evolution of west-central South America.” Bivariate kernel density estimates of detrital zircon U-Pb and εHf(t) data from Peruvian Altiplano Cenozoic strata shown as three-dimensional volume (left) and two-dimensional view parallel to the z-axis (right).

Figure from Thomas et al. (2020), Geosphere: “Detrital zircons and sediment dispersal in the eastern Midcontinent of North America.” Comparisons of εHft data for the Michigan, Illinois, and Forest City basins with respect to the Appalachian basin (A—Mississippian samples; B—Pennsylvanian–Permian samples, except those in panel C; C—Pennsylvanian samples with strong Pan-African/Brasiliano age concentrations).
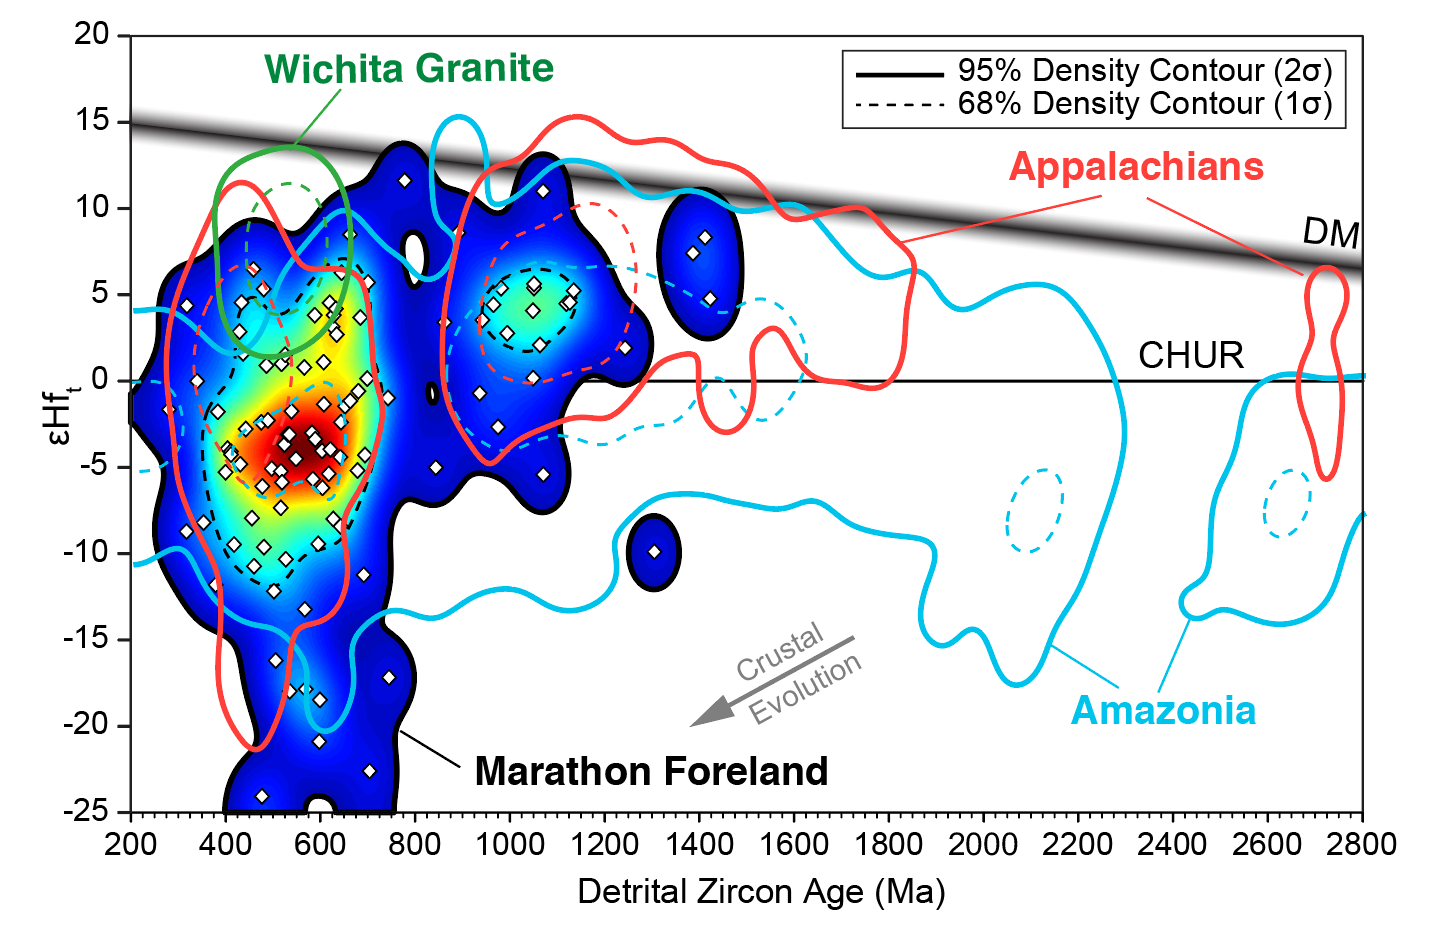
Figure from Thomas et al. (2019), Geosphere: “Detrital zircons and sediment dispersal from the Coahuila terrane of northern Mexico into the Marathon foreland of the southern Midcontinent.” Plot of εHft data to compare results from Laurentia and the Appalachians, Gondwana/Amazonia (from Pepper et al., 2016), Southern Oklahoma igneous rocks (from Thomas et al., 2016), and Marathon foreland. The Appalachian data exclude identified Gondwanan accreted terranes in the Appalachian internides but include detrital zircons from Gondwanan sources in the Appalachian foreland (from Thomas et al., 2017). The Amazonia data are from various primary sources in South America (from Pepper et al., 2016). Data from the Wichita granites show the distinctive positive εHft values for Iapetan synrift rocks (Thomas et al., 2016).
DOCUMENTATION

Latest MATLAB code available in our GitHub Repository, download and/or contribute!

Example data sets; these work for all versions — Running in MATLAB or compiled programs

Latest compiled release for Mac. This requires the MATLAB Runtime Compiler (link here!)

Brief description of what HafniumPlotter is and a few example plots

Latest compiled release for PC. This requires the MATLAB Runtime Compiler (link here!)

Tutorial on producing publication-ready plots and data tables — coming soon!
Published in Sundell et al. (2019) Andean TectonicsVideo Tutorial
GSA Connects Online 2020 Short Course