Central Andes

Ausangate in the southern Peruvian Eastern Cordillera
Research Topics

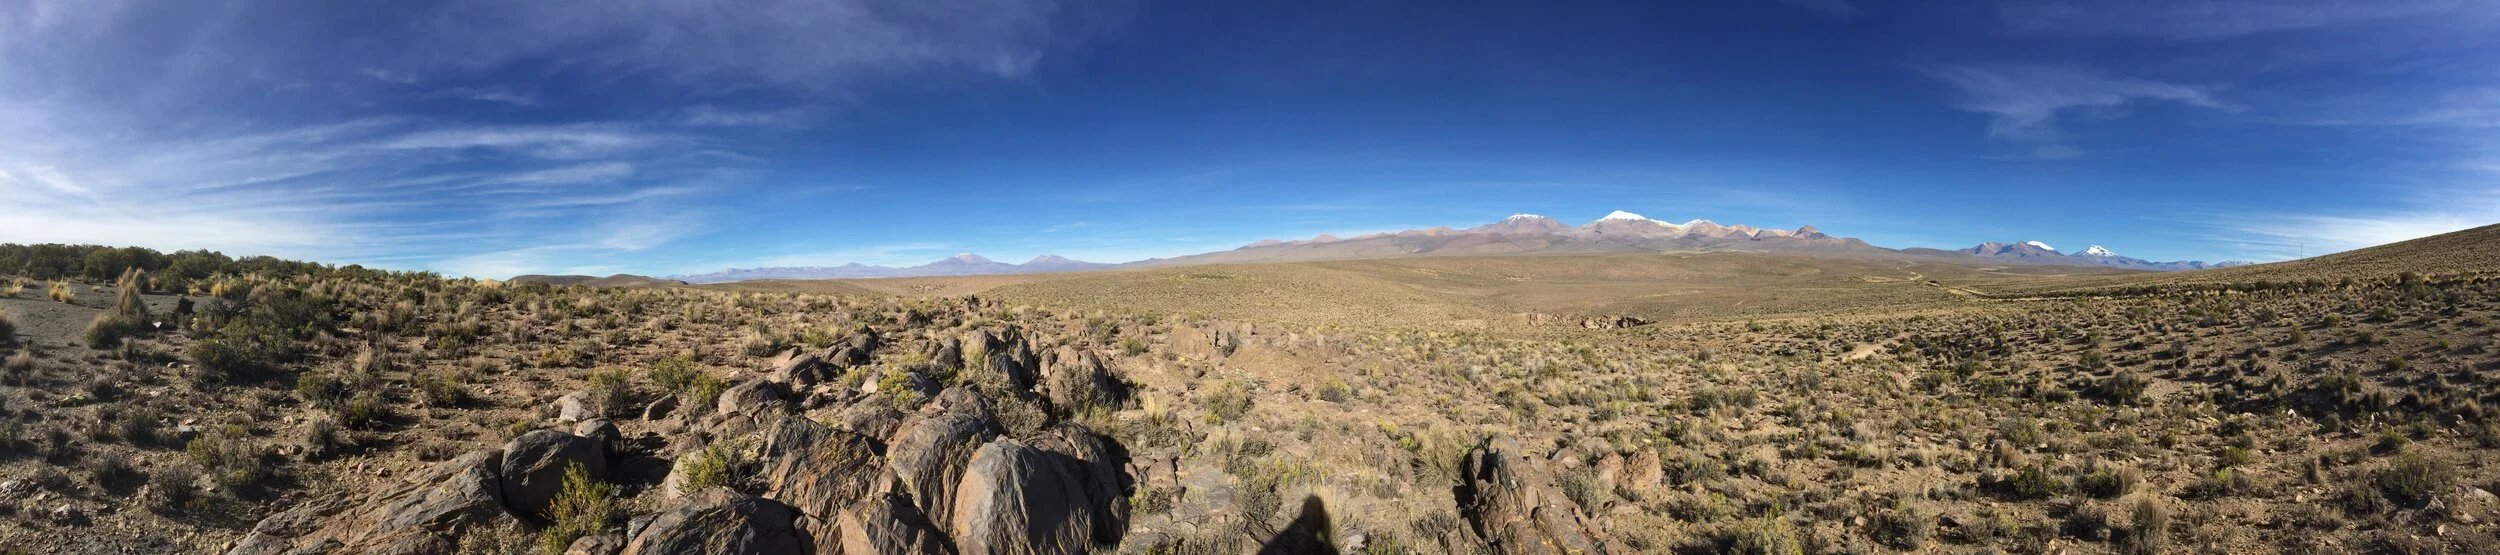
In the middle of nowhere, Altiplano

Paola Zapata walking a beautiful section next to Lake Titicaca

Joel Saylor measuring volcanic stratigraphy near Puquio, Peru
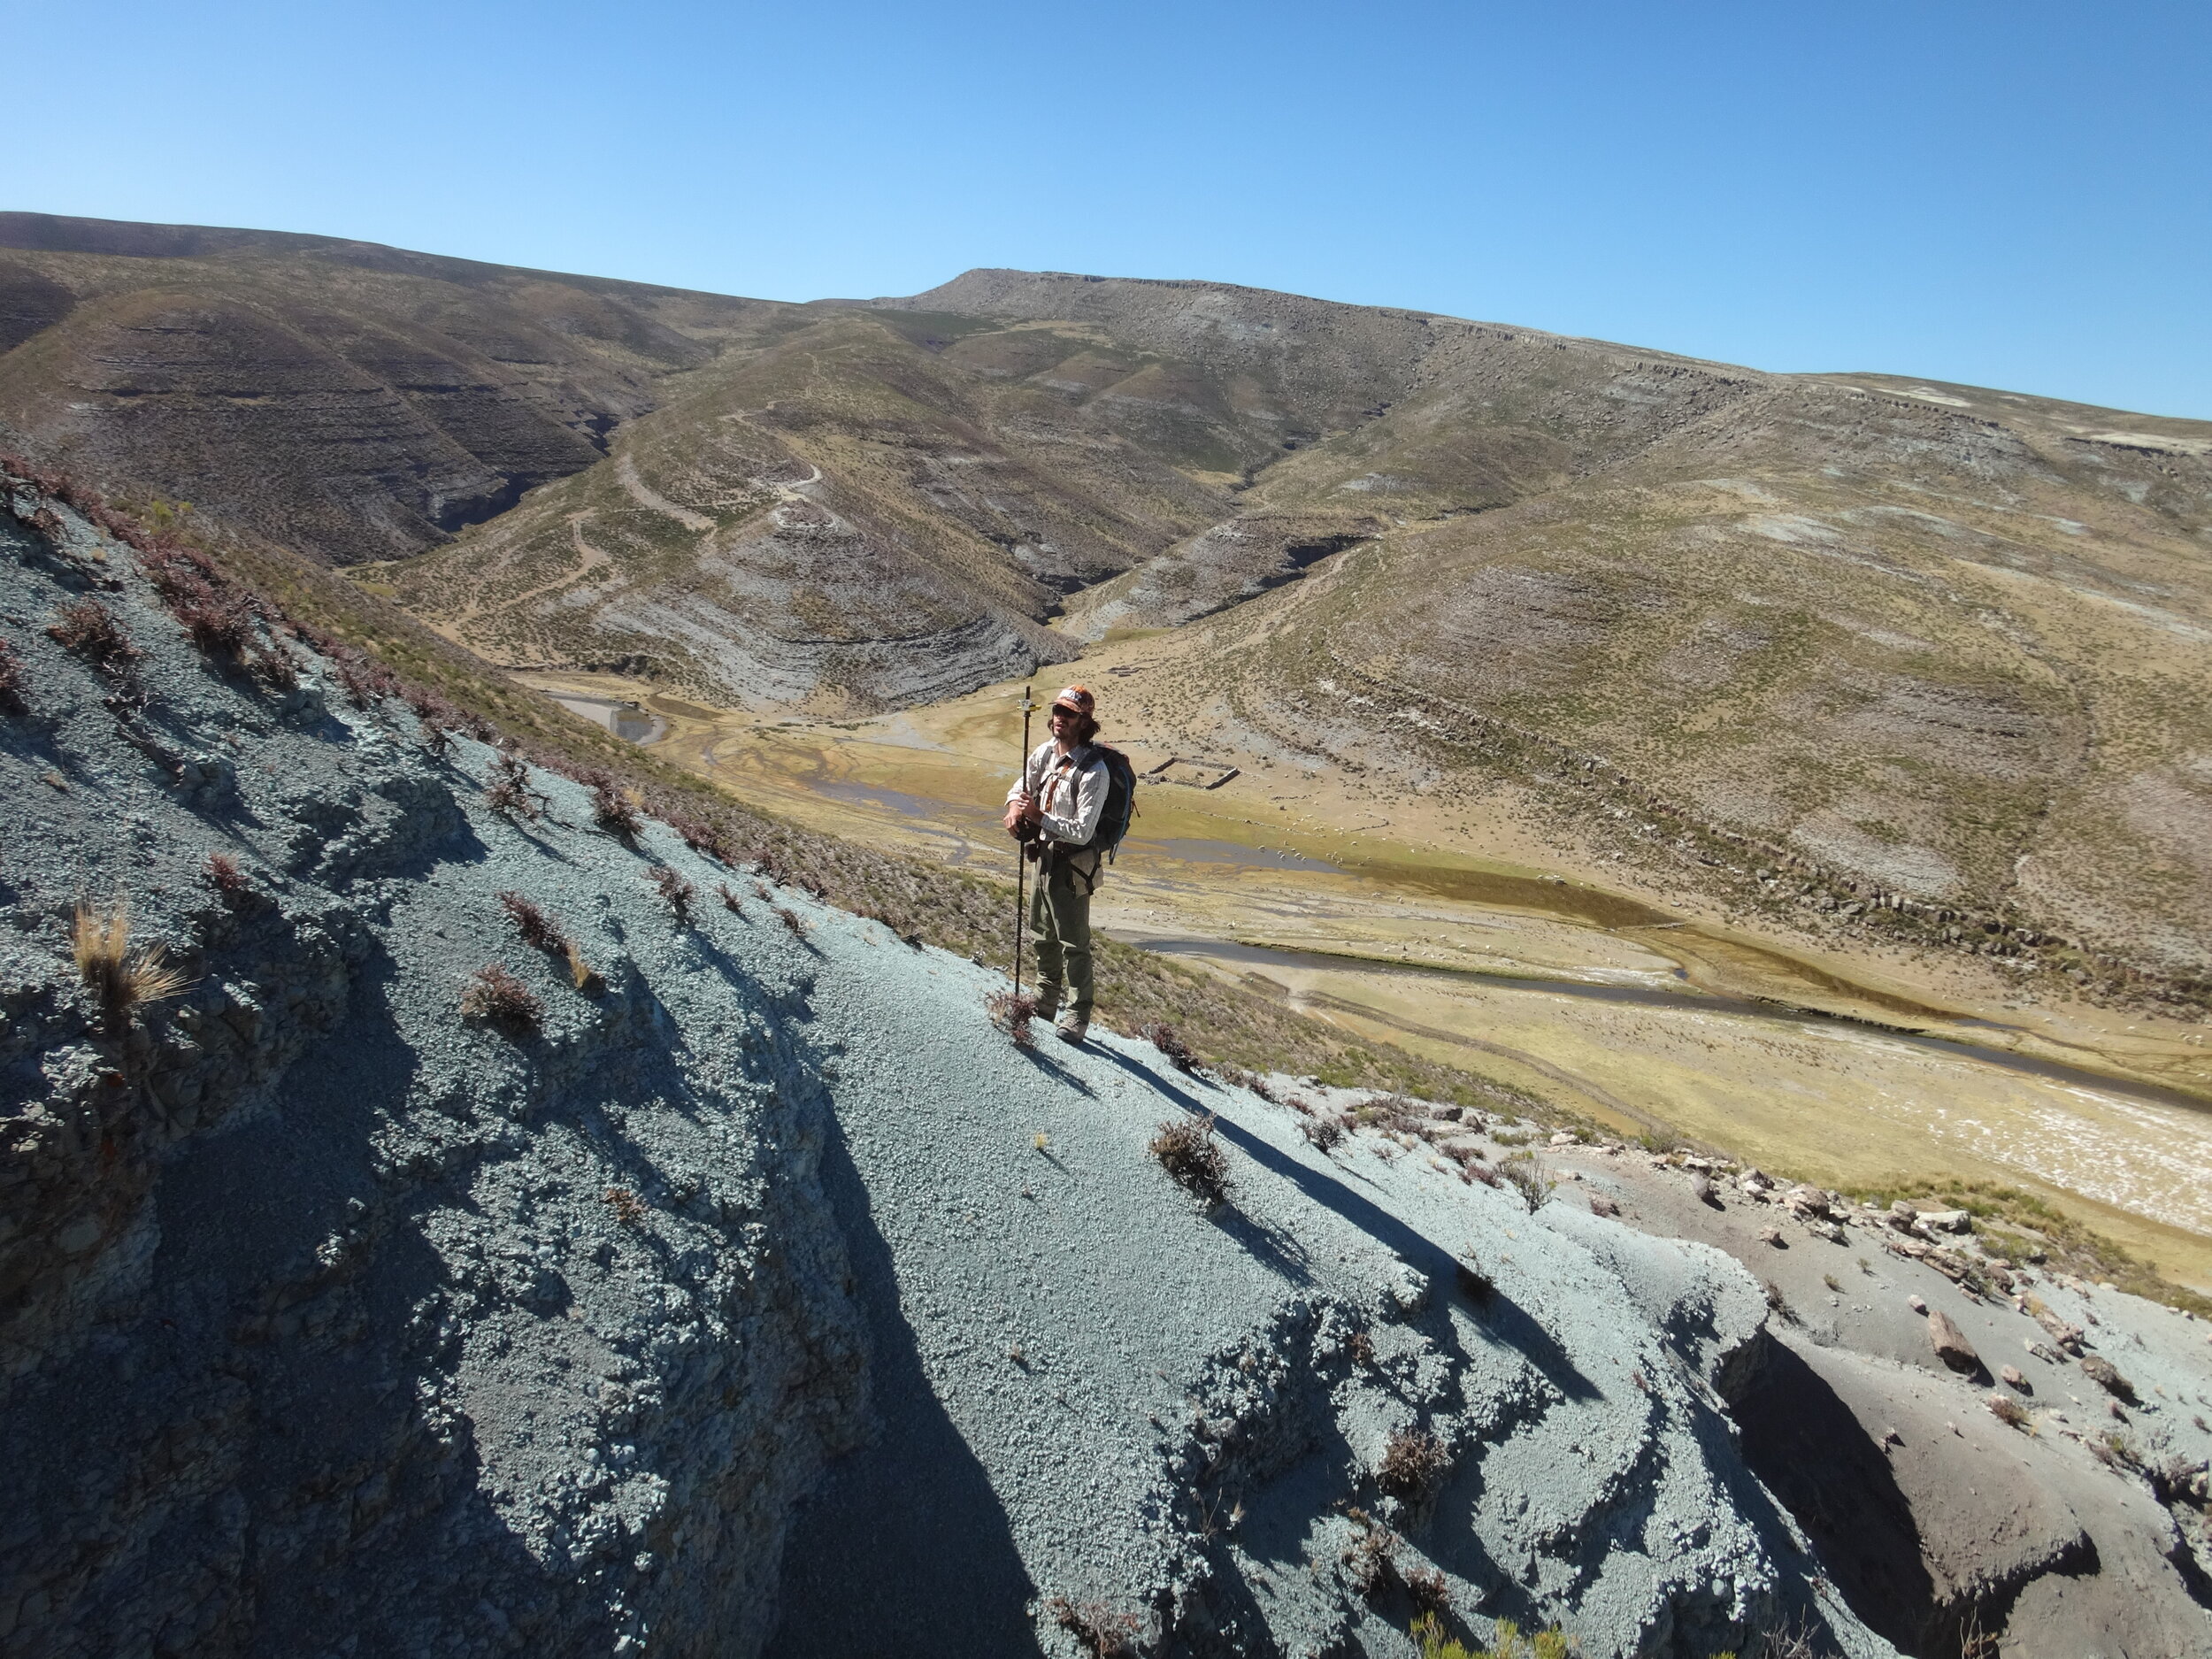
Richard Styron measuring some strange blue stratigraphy

Active stratovolcanoes in the Bolivian Western Cordillera

Standing next to some overturned strata in the Altiplano
Central Andes
Altiplano Basin Evolution
cenozoic retroarc foreland basin evolution, Southern Peru
This ongoing project incorporates traditional field-based stratigraphic tools including facies analysis, paleocurrent measurements, sandstone petrography, as well as detrital zircon U-Pb geochronology. The primary objectives of this project are to understand Cenozoic sediment dispersal, drivers of basin subsidence, and retroarc evolution that took place during Cenozoic mountain building.

Early morning drive from Cusco to Punacancha.

(a) Digital elevation model (DEM) of the Andean plateau from HYDRO1K data. (b) Physiographic regions of the northern extent of the Andean plateau. PC = Precordillera; SAZ = Subandean zone. (c) Regional geologic map of southern Peru showing Cenozoic stratigraphic formations and Paleozoic-Cenozoic intrusive units (modified from Carlotto, 2013) overlain upon a hillshade DEM generated from Shuttle Radar Topography Mission 90 m data. Sundell et al. (2018), Tectonics. Map Location Here!

Geologic map of the study area modified from the Instituto Geológico Minero y Metalúrgico and Carlotto (2013). DZ = detrital zircon. From Sundell et al. (2018), Tectonics. Map Location Here!

Richard Styron using the ‘hands of geology’ to properly orient this overturned Eocene strata.

Calcareously cemented mudstone interpreted at the transition from lacustrine to fluvial depositional environment.

Dustin Villarreal checking out razor sharp non-erosive surface at the base of a thick clast-supported cobble to boulder conglomerate.

Horizontally laminated very fine grained sandstone. Evidence of high velocity, shallow supercritical fluid flow.

Beautiful ripple cross stratification.

Overturned trough cross strata.

Composite Cenozoic stratigraphic section of the northernmost Altiplano showing lithofacies codes to the right corresponding to observations and interpretations of depositional processes listed in Table 1 and described in section 3.1.1. The base of each section is specified by the beginning of the formation name to the left of the section. Paleocurrent data are shown as black arrows (north is up, arrow points toward sediment transport direction; N = stations, n = individual measurements). Conglomerate clast count results are shown as pie diagrams. From Sundell et al. (2018), Tectonics.

(a) Foreland basin evolution in the context of a migrating foreland basin system (DeCelles & Giles, 1996). WC = Western Cordillera; EC = Eastern Cordillera. Timing of punctuated shortening (magenta boxes) inferred from mixture modeling. (b) Sediment accumulation rates calculated from measured sediment thicknesses and detrital zircon U-Pb maximum depositional ages (note that sediment compaction has not been taken into account). From Sundell et al. (2018), Tectonics.

Sediment accumulation curves of foreland basin strata documented in the modern Altiplano and Eastern Cordillera for the Andean plateau. Note the systematically younger onset of rapid sediment accumulation to the south and thicker foredeep deposits in the north. From Sundell et al. (2018), Tectonics.
Central Andes
Late Cenozoic Surface Uplift
Variable Late Cenozoic Surface Uplift Across Southern Peru
This field-based project is focused on regional records of surface uplift across southern Peru from the Western Cordillera, through the Altiplano, and into the Eastern Cordillera. We combine basin analysis with zircon U-Pb geochronology and volcanic glass stable isotope paleoaltimetry. The goal is to test geodynamic models controlling the attainment and support of high topography and resulting surface-uplift-induced changes in modulations in regional paleoclimate.

Another beautiful day of fieldwork in the Tincopalca basin in the Western Cordillera of southern Peru!

Study area, sample locations, and modern water elevation modeling. (A) Digital elevation model showing the northern extent of the Andean plateau generated from Shuttle Radar Topography Mission (SRTM) 90m elevation data. Physiographic regions characterizing the central Andes: AY = Ayacucho, WC = Western Cordilleran, AP = Altiplano. EC = Eastern Cordillera. Topographic swaths along a–a’ and b–b’ are 140 and 340 km wide, respectively; the dashed line is an arbitrary cutoff between the topographic swaths and modern water data shown in part (B). Modern water data include results from Bershaw et al. (2016), and volcanic samples include results from Saylor and Horton12. (B) Topographic swaths showing mean, minimum, maximum, and 1σ standard deviation elevation. Modern water measurements are color-coded to d-excess values. White circles are mean catchment elevations calculated from modern waters using a modified non-linear isotopic lapse rate (Rowley and Garzione, 2007). Sundell et al. (2019), Scientific Reports.

Sampling location in the Eastern Cordillera in southern Peru near Macusani. Glass from these ~10 Myr volcanic rocks is in isotopic disequilibrium with the modern river water.

Field assistants hard at work near Puquio in the Ayacucho region of southern Peru.

Modern water stable isotope results, lapse rates, and residuals. (A) Modern water δDw and δ18Ow (relative to VSMOW) compared to GMWL and color-coded to d-excess. Negative d-excess values are interpreted to be the result of moisture modified by evaporative effects, whereas positive d-excess values are interpreted to be the result of moisture recycling. Results include water data from Bershaw et al. (2016) (B) δDw values converted to elevation based on a non-linear isotopic lapse rate modified from Rowley and Garzione (2007). (C) Residuals (mean catchment elevations – modeled elevations); the majority of water values yield overestimates in catchment mean elevation resulting in a negative mean residual (-246 ± 427 m at 1σ). Sundell et al. (2019), Scientific Reports.

Isotopic lapse rates used to calculate paleoelevation and surface uplift magnitude. Lapse rates include: thermodynamically-derived non-linear Rowley (2007); isotope-tracking general circulation model (GCM) with 25, 50, 75, and 100% of Andean elevations Insel et al. (2012); linear empirical ; and GCM with 50 and 100% Andean elevation Poulsen et al. (2010). Note the similarity in the Insel et al. (2012) and Rowley (2007) best-fit lapse rates.

Paleoelevation results compared to published paleoelevation estimates and ancillary geological data. (A) Sample locations for this and previous studies; only absolute elevation estimates are included. Results reveal variable surface uplift records consistent with previous studies for the (B) central Western Cordillera (15°S–15.5°S), (C) southern Western Cordillera (15.5°S–17°S), (D) Altiplano, and (E) Eastern Cordillera. Paleoelevations were calculated based on the thermodynamic lapse rate (Garzione et al., 2007) and incorporate a climate correction that accounts for Oligocene – Pleistocene global cooling. Youngest low elevation age for Kar et al. (2016) calculated assuming a linear sedimentation rate in the Descanso Formation. Shaded horizontal colored bars in parts B-E are ±1σ standard deviation of modern elevation. Scientific Reports.
Central Andes
Crustal Thickening
Northern Central Andean Plateau of Peru, Bolivia, and Chile
This project is currently under development and incorporates apatite, zircon, and baddeleyite single-mineral petrochronology by laser ablation ICP-MS. The goal here is to determine the timing, rate, and spatial variability of crustal thickness for comparison to records of surface uplift to test models explaining the Cenozoic construction of the Central Andean Plateau.
Sampling igneous rocks in the desolate far reaches of Western Cordillera in Bolivia.
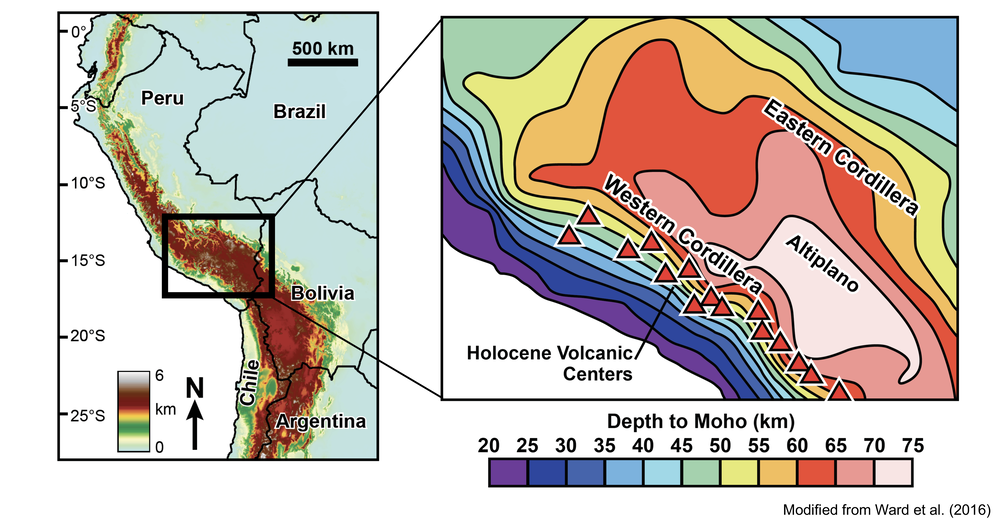
Extreme modern crustal thickness of the northern Central Andes (Sundell et al., in prep).

Method for deterining crustal thickness changes from intermediate igneous rocks with 60 to 70 percent silica by weight. This window avoids deep mafic melts that undergo major diversification during homogenization in the MASH zone, and highly fractionated melts or melting of metasedimentary rocks in the upper crust that tell us little about crustal thickness (Sundell et al., in prep).
Central Andes
ZIRCON HAFNIUM GEOCHEMISTRY
Crustal Evolution of Western Gondwana From Altiplano detrital zircons
This project is focused on interrogating detrital zircons from the northern Altiplano using paired U-Pb geochronology and Lu-Hf geochemistry by laser ablation multi-collector ICP-MS. The whole project was exploratory in nature (i.e., the hypotheses at the outset were not clearly defined, the style of science I love the most because one goes in with absolutely no bias). The goal was to try and glean insights into the derivation of detrital zircons currently locked up in Cenozoic Altiplano stratigraphy.
Where did these detrital zircons come from?
What we found in this project was surprising. We knew at the outset, based on previous research, that many of the age groups common in South America would be non-unique, for both age and Hf isotopic signature… But, it turns out there are some populations with very limited potential sources in modern day South America, one of which is the Ediacaran - Cambrian age range, which has a uniquely evolved Hf isotopic signature (i.e., lots of old radiogenic crustal material incorporated into the melt in which those zircons grew). This led us to try and pinpoint that location and to see what it could tell us about the crustal evolution of this part of the world.

Simplified age province map of South America modified from Pepper et al. (2016) and references therein. Andean Tectonics.

Map of the study area and Cenozoic stratigraphy modified from Sundell et al. (2018). Geologic map was originally sourced from Instituto Geológico Minero y Metalúrgico (INGEMMET) and Carlotto (2013). Triangles on fault lines indicate thrust hanging wall. Green map units are Cretaceous sedimentary rocks. Light blue lines are measurement locations for the composite stratigraphic section. Blue filled circles are sampling locations for detrital zircon U-Pb and Hf analysis. Numbers right of Cenozoic timescale are single-grain maximum depositional ages. Paleocurrent measurements from (N = stations, n = individual measurements). Andean Tectonics.

Combined detrital zircon U-Pb geochronology and εHf(t) geochemical results. (A) All U-Pb–εHf(t) data from the Cenozoic Altiplano from this study (n = 305). (B) Kernel density estimates of U-Pb ages from this figure (20 Myr set kernel), including ages from this study and from Sundell et al. (2018), and characteristic age ranges for detrital zircon data in the northern central Andes shown as vertical bars in all plots. (C) Combined U-Pb–εHf(t) results for Miocene strata (lower and upper Paruro Formation). (D) Combined U-Pb–εHf(t) results for middle to late Oligocene strata (lower and upper Punacancha Formation). (E) Combined U-Pb–εHf(t) results for Paleocene–Eocene strata (Quilque, Kayra, and Soncco formations). DM = depleted mantle.

Combined U-Pb–εHf(t) results plotted as bivariate kernel density estimates for (A) Andean zircons <200 Ma (5 Myr and 2ε unit set kernel bandwidths) and (B) pre-Andean zircons 2000–200 Ma (50 Myr and 2ε unit set kernel bandwidths). (C) Two-dimensional (2D) view of three-dimensional (3D) plot in part A. (D) 2D view of 3D plot in part B. DM = depleted mantle. White lines represent 95% of the maximum intensity in each plot.

Previously published (A) detrital εHf(t) data and (B) in situ εHf(t) data plotted over contoured bivariate kernel density estimates of U-Pb–εHf(t) for 2000–200 Ma from Fig. 5D. (C) Published in situ εNd(t) data from crustal provinces in South America. DM = depleted mantle.

Comparison of Cenozoic Altiplano U-Pb–εHf(t) 95% density contours for 2000–200 Ma detrital zircons from central Andean modern rivers and beaches (Pepper et al., 2016), Cenozoic Altiplano sandstones (this study), and Paleozoic sandstones (Reimann et al., 2010). Note that the Paleozoic contour does not share the significant late Neoproterozoic isotopic pull down of the Cenozoic and modern U-Pb–εHf(t) contours.